![]()
![]()
Chapter 9 - Disk Information and Usage Statistics
This chapter describes statistics about disk use for a selected VINES server.
To view disk statistics, choose SHOW disk usage statistics from the VINES Network Summary menu. The Disk Use screen appears.
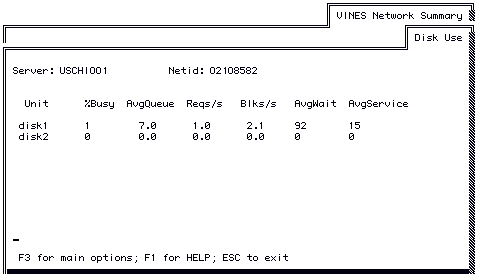
The Disk Use screen shows a table with each row representing the activity for a single disk unit. The names of the disks are in the left-most column. The item entries are named by headings in the first row. Press ESC if you wish to return to the VINES Network Summary menu.
The statistics that appear on the screen show you disk usage activity over the last 5 minutes, and are updated every minute. For example, a statistic that is calculated at 10:00 reflects activity from 9:55. The statistic is calculated again at 10:01 and reflects activity from 9:56, and so on.
All averages are flat averages.
The sections that follow explain the data on the Disk Use screen.
Unit
The name of the disk unit. Statistics are reported on the entire physical disk.
%Busy
The percentage of time that the disk spent servicing data transfer requests.
In conjunction with the AvgQueue and AvgWait statistics, the %Busy statistic tells you whether a disk is overloaded or whether disk load is divided evenly among all disks. For example, in the sample Disk Use screen, the %Busy, AvgQueue, and AvgWait statistics all indicate that disk1 handles a much heavier load than disk2. To divide the load evenly, you could move services from disk1 to disk2. When new services are added to the server, you would add them to disk2.
AvgQueue
The average length of the request queue, which is measured in terms of the number of read and write requests in the queue. The request queue is an internal list of read and write requests that are waiting to be serviced by the disk.
In conjunction with the %Busy and AvgWait statistics, the AvgQueue statistic tells you whether a disk is overloaded or whether disk load is divided evenly among all disks. For example, in the sample Disk Use screen, the %Busy, AvgQueue, and AvgWait statistics all indicate that disk1 handles a much heavier load than disk2. To divide the load evenly, you could move services from disk1 to disk2. When new services are added to the server, you would add them to disk2.
Reqs/S
The average number of read and write requests per second. A single request can account for any amount of data read or written.
Blks/S
The average number of 1KB disk blocks that were read or written per second.
If you divide Blks/s by Reqs/s, you get the average number of blocks transferred per request.
The average amount of time, in milliseconds, that read and write requests waited on the request queue to be serviced.
In conjunction with the AvgQueue and %Busy statistics, the AvgWait statistic tells you whether a disk is overloaded or whether disk load is divided evenly among all disks. For example, in the sample Disk Use screen, the %Busy, AvgQueue, and AvgWait statistics all indicate that disk1 handles a much heavier load than disk2. To divide the load evenly, you could move services from disk1 to disk2. When new services are added to the server, you would add them to disk2.
AvgService
The average amount of time, in milliseconds, that the disk took to service read and write requests.
![]()
![]()
![]()